Practice Exercises

You can use the Summary tab to collect the mean results from each of the 5 methods to compare to the true values. To provide a sense of the spread of period estimates for each method, a histogram of errors in the period estimate across the set of samples is given for each method.

All 5 methods provide period estimates, but only the DWT and sine-fit methods also provide amplitude and peak time estimates. Only the autocorrelation and Lomb-Scargle methods provide significance tests for rhythmicity.

Which method may work best depends on the characteristics of the time series under consideration: waveform, noise, sampling interval, length, etc. Some basic advice is provided in the Advice tab. Reading the suggested references to develop a deeper understanding of each method is strongly recommended.

Try a few exercises to see if you can draw some basic conclusions from use of this app.


Exercise 1:

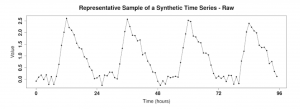
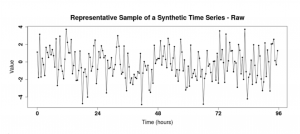
In some cases we can only collect 3-4 days of data and the signal is masked by a lot of noise. Play with the settings until you have a waveform that looks noisy and only have 3 days.

Now set the number of samples to generate to “20” and click “Go”. The Shiny App will run 5 different analyses on your simulated data set. You know the true values for period, phase and percent rhythmic, and now you can compare the values generated by your analysis to the true values. Click through each tab to visualize the results from each method. Study the summary tab to get an idea of how the results compared. There may be more than one method that works well, or a method that works best for estimating period while another works best for estimating phase. Thus, what are your conclusions for the best analysis tools to use on time series data that is noisy and short? (There may be more than one method that works well, or a method that works best for estimating period while another works best for estimating phase.)

Exercise 2:

Let’s look at another type of data. Play with the settings until you have a triangular waveform that is not very noisy.

Run the analysis and compare the results for each method. Again, there may be more than one method that works well, or a method that works best for estimating period while another works best for estimating phase. Thus, what are your conclusions for the best analysis tools to use on time series data such as this? (Again, there may be more than one method that works well, or a method that works best for estimating period while another works best for estimating phase.)