Types of Interactive Content
Media Production
H5P Interactive Content
Mapping Tools
Timelines
- ☆TimelineJS (horizontal timeline)
- ☆Cool Timeline (vertical timeline)
Support for Creating your Content
Equipment Loan and Media Resources
- How to Borrow Cameras and Recording Equipment
- Free Media Sources – Collected sources for free to use media
Adding your digital project
Note: All links to directions or examples open in a new tab
Types of Interactive Content
There are lots of ways to add digital content to a WordPress page.
Media Production
☆ Podcasting and Video Production
Creating a podcast or a video are great ways to tell a story using audio or video.
Once you’ve created a podcast or a video, you can add it to your course site.
☆ Digital Narratives
Digital Narratives are short-form videos. In a digital narrative, the main content is typically driven by audio narration accompanied by music, image, and video. These visuals can be sourced from stock footage/images or original footage/images.
Example Digital Narratives
- Eve Mehalick Wilcox ’22 – Environmental Justice in New York’s Capital Region
- Meredith Jones ’24 – Centering Emotional Knowledge and Relationships in Fight for Climate Justice
☆ Zines
Zines can be created with physical or digital materials, typically a digest (5.5 x 8.5in) or half-letter size. To create a digital zine, you can use any graphic design or content creation software (i.e. Adobe Express, Canva, Google Slides, etc.) as long as you export your final product as a PDF. That PDF can then be embedded on the class WordPress site for visitors to page through.
Example Zines
☆ H5P Interactive Content
H5P is a tool used to make interactive content, so that when someone visits a website they can interact with text, images, and sounds in different ways. H5P content types include images with clickable hotspots, virtual 360 tours, information panels, and even slideshows. For even more options, look through H5P content types and applications.
Image Hotspots
The Image Hotspot H5P type allows you to annotate an image with text, images, and videos.
Virtual Tour with 360 Camera
The Virtual Tour tour H5P type allows you to make an interactive virtual tour using images from a 360 camera or still images.
Information Wall
The Information Wall type allows you to create a concise wall of content panels that a visitor can search for information.
Mapping Tools
☆ Create a map with StoryMapJS
StoryMapJS is a free mapping tool that guides a visitor through a sequence of locations. You can add with images and text to your map to describe important features, note access challenges, or illustrate the location.
☆ Create a map with ArcGIS StoryMaps
ArcGIS StoryMaps is a mapping and visual storytelling tool. StoryMaps can include a variety of maps, including interactive maps with popups and images, guided and unguided (explorer) tours, map sliders that allow you to compare multiple views of the same place, and maps with supplemental data. You can also add additional text, images, videos, and other embedded content, and change the appearance of your map or overall design.
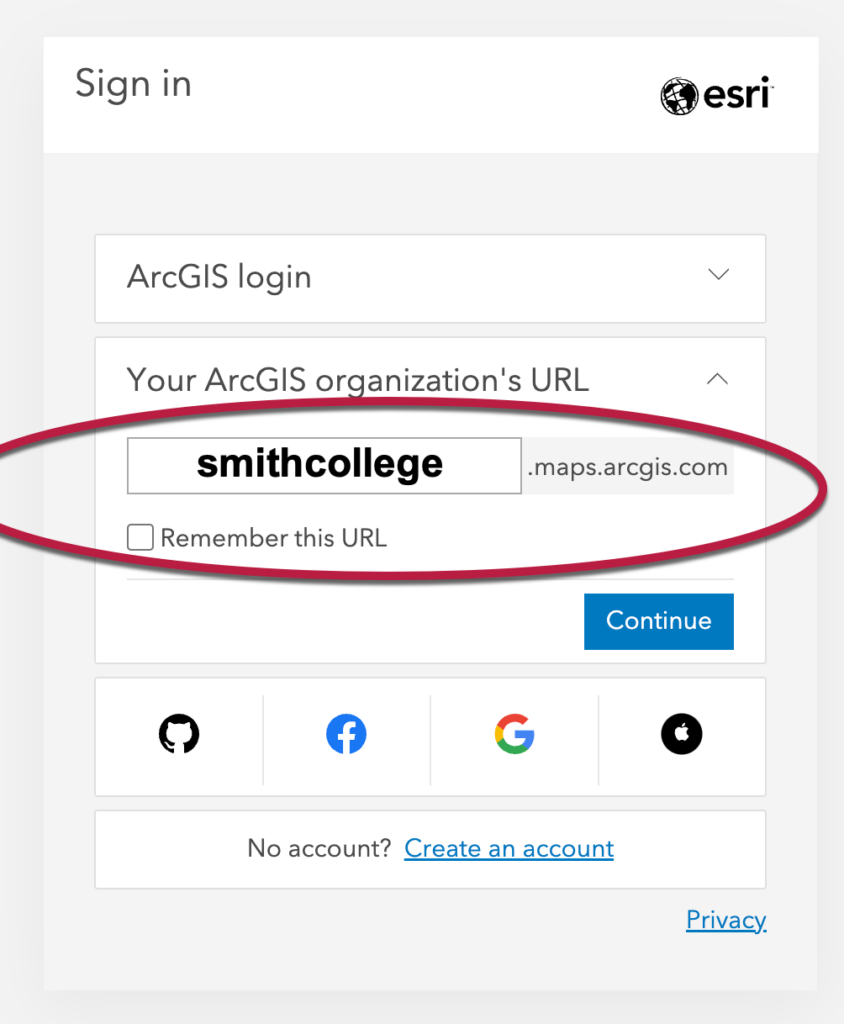
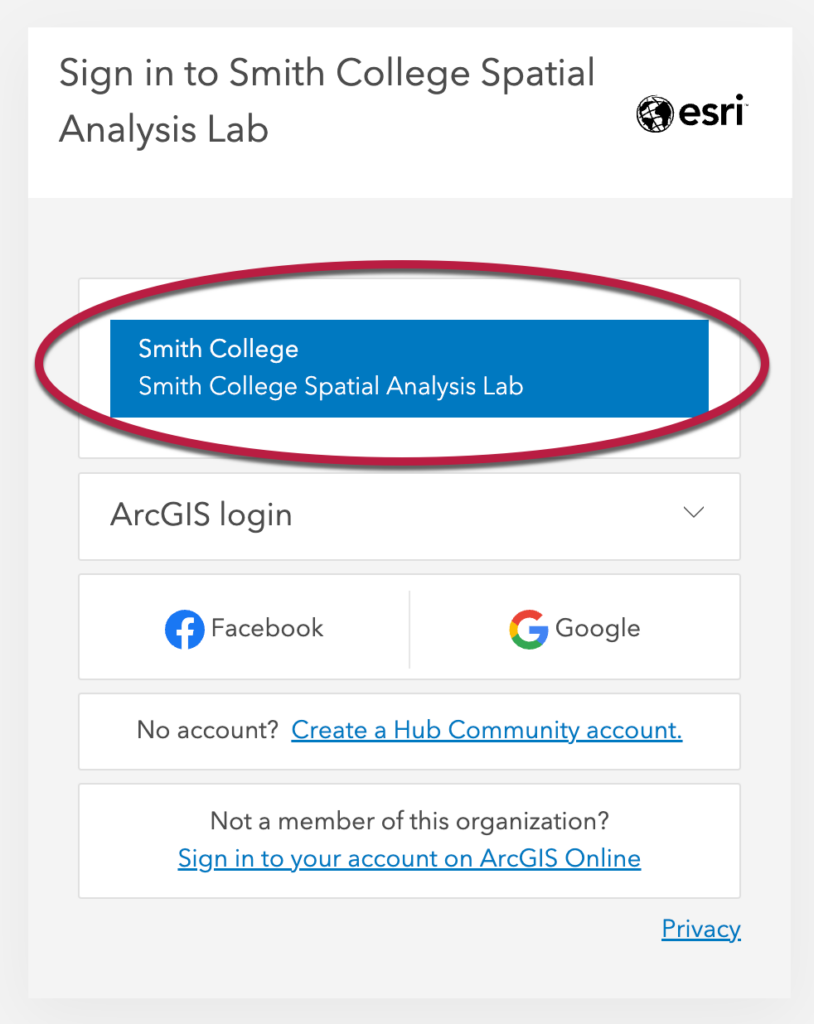
To create an ArcGIS StoryMap, log in to https://www.arcgis.com with the Your ArcGIS organization’s URL option. Type “smithcollege” as your organization, click the blue button that appears on the next screen, and follow the Duo login prompts.


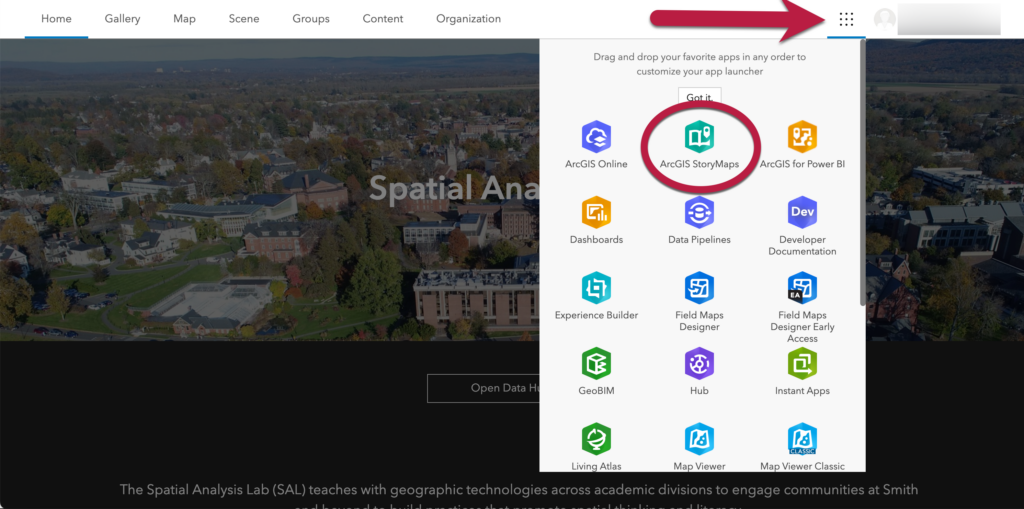
Then click the StoryMaps launch button or open https://storymaps.arcgis.com/ and start a new story.

Additional self-guided instruction is available here, or contact sal@smith.edu for support or a walkthrough.
Wondering how to choose between StorymapsJS and ArcGIS StoryMaps? The answer is partly stylistic: each offers different types of maps, layout, and design options. StorymapsJS is more accessible in terms of being free, ArcGIS StoryMaps is more accessible in terms of offering a high-contrast basemap and other visual and cognitive accessibility options.
Example StoryMaps
Timelines
Using a timeline tool is a way to create a sequence of different events. There are two different timeline tools
TimelineJS is a great way to create horizontal timelines. TimelineJS is an opensource tool created by Knightlab that uses a Google Sheet as the bases for interactive timelines that support text and images, audio, and video.
Cool Timeline is a way to create vertical timelines using the Cool Timeline block in WordPress. Cool Timeline supports images and text.
Adding your Content to the Class Website
Creating a WordPress post on the Class Website
To add your content to the class site, you’ll need to create a new post, add some explanatory text, and add your digital project.
How to Create a WordPress Post and add content
Embedding Projects
Depending on your digital project, you may need to link or embed it in your page.
- StoryMapsJS
- Follow the directions to copy the share link and paste it in your WordPress Post
- Adding Content created online
- Adding Digital Narratives or other Audio/Video