Analytical Techniques
Chemical analysis of the surface was done through three non-destructive analytical techniques, X-ray Fluorescence, Scanning Electron Microscope, and Energy Dispersive X-ray Spectroscopy.
X-Ray Fluorescence (XRF)
XRF is the first analytical technique used on the collection. A Bruker Tracer III-V+ X-ray fluorescence (XRF) spectrometer with a K 4084 Rhodium tube, channel 2048, and 40 kV connected to Bruker S1PXRF software to analyze these samples. XRF spectroscopy determines the elemental composition of whatever material you are analyzing.
Each run was collected in a 30-second scanning period, and this data was then exported to the Artax software for analysis. For each object, the handheld machine was manually directed and placed on different areas of the object. Data was collected from various locations on the object to try to generate a full image of the surface composition.
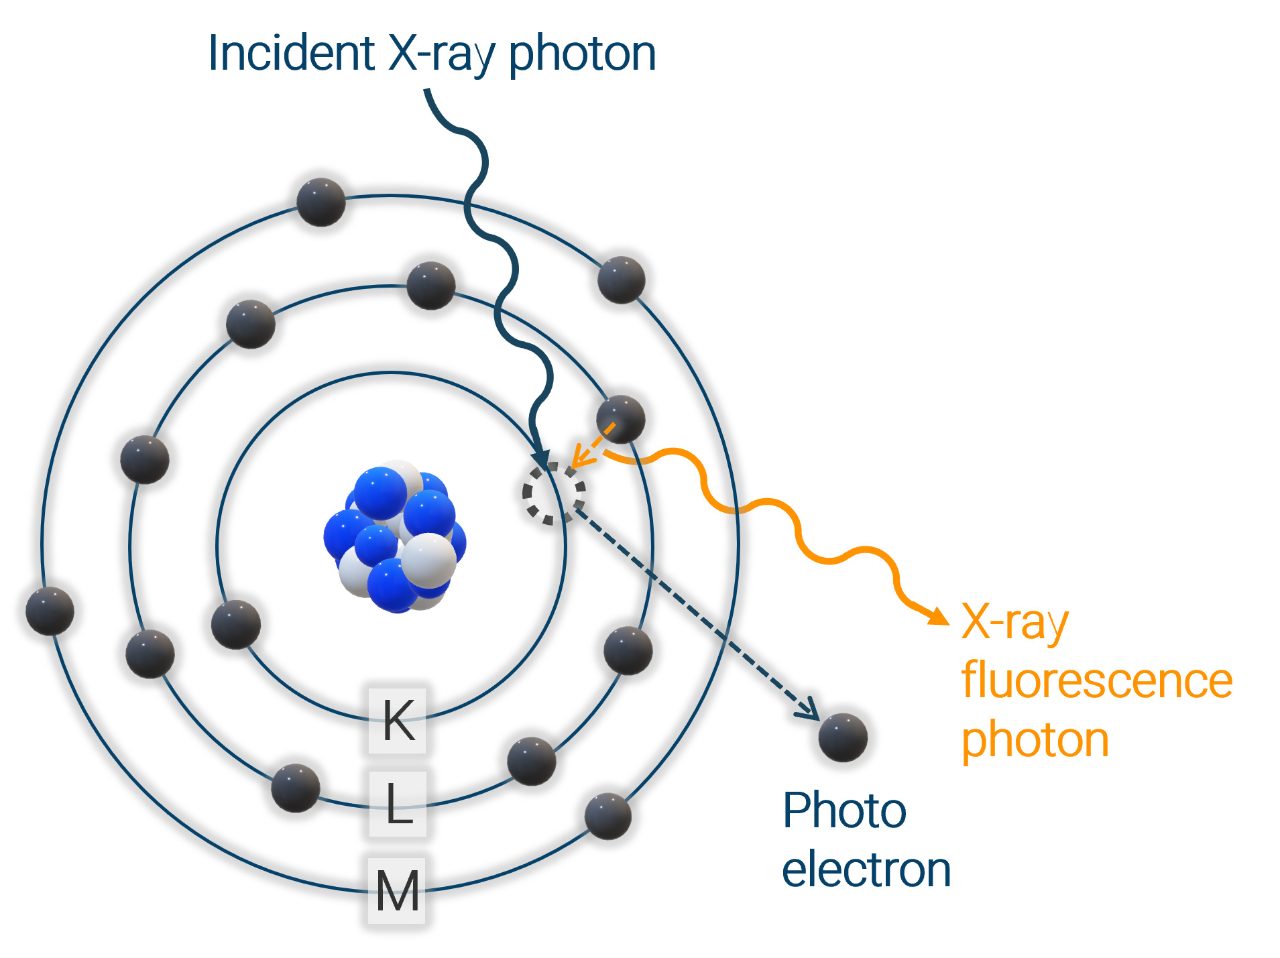
XRF works using three things: 1) X-rays, 2) electrons, and 3) energy! When using an XRF, you point the X-ray source at the material, which comes from the rhodium tube, and shoot a high-energy ‘incident’ X-ray. This X-ray causes the electrons in the material to fluoresce. This doesn’t mean that the material starts to glow, but instead goes through the process of absorption, relaxation, and emission. In this process, electrons, after being exposed to the X-rays, absorb the high energy and are emitted from their orbital. This leaves a gap that needs to be filled. An electron that is situated on a higher energy orbital level falls down to fill the gap, lowering the energy, which is favorable. Energy is released in this process in the form of a photon, which releases a secondary x-ray, which is characteristic of the element present.
XRF generates a spectrum of the elements detected in the material. On the spectrum, peaks correlate to a possible elemental match. Using the net intensity of each unique secondary x-ray emitted, you are able to understand the total composition of the surface material roughly.
Our goal was to determine the relative surface composition of each object. Through this, objects were narrowed down due to the presence of chlorine.
Scanning Electron Microscopy
Scanning electron microscopy (SEM) provides high-resolution images and detailed surface information of samples. The resolution of SEM instruments works within micrometers! This means that objects that are just a tiny crumb look like mountains, and the surface can be clearly visualized. To prepare our samples, corrosion product was taken from the surface of four objects using a scalpel. This was placed on metal stubs with carbon tape between the stub and the sample.
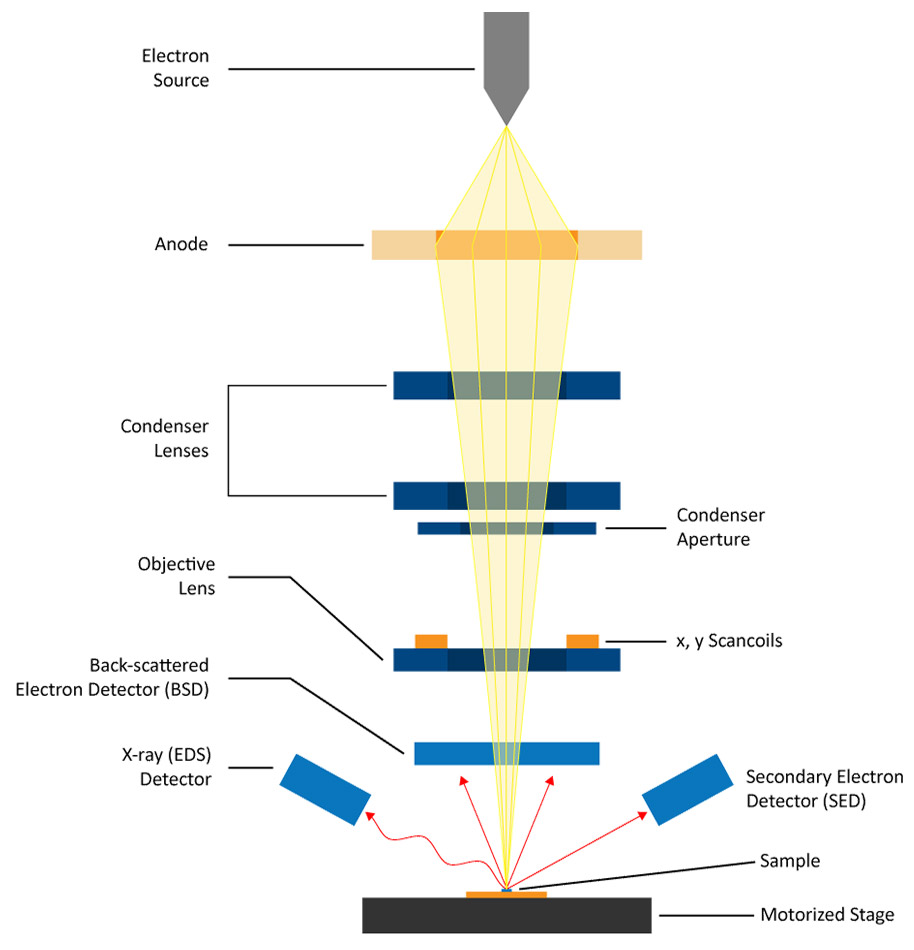
An electron beam comes from the electron gun at the instrument’s top. This beam is accelerated and focused by a series of lenses, creating a high-energy beam that is directed onto the sample. Two types of emissions are detected, secondary electrons and backscattered electrons.
Secondary electrons (SE) are low-energy electrons resulting from the inelastic scattering of the incident electron beam with the sample. By detecting these electrons, we can create high-resolution topographic images, which provide information about the surface of the object!
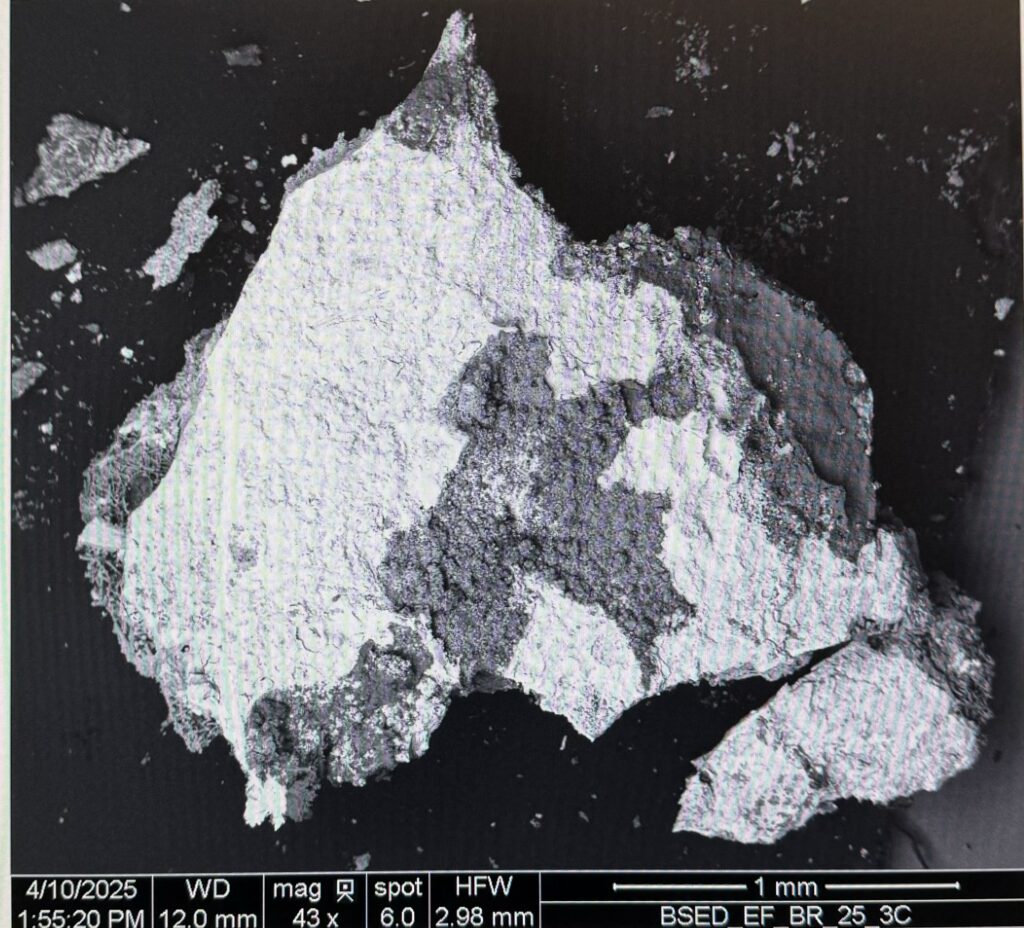
Backscattered electrons are high-energy electrons that are elastically scattered from the sample. By detecting these electrons, images correlated to compositional information are created.
Energy-dispersive X-ray spectroscopy (EDS)
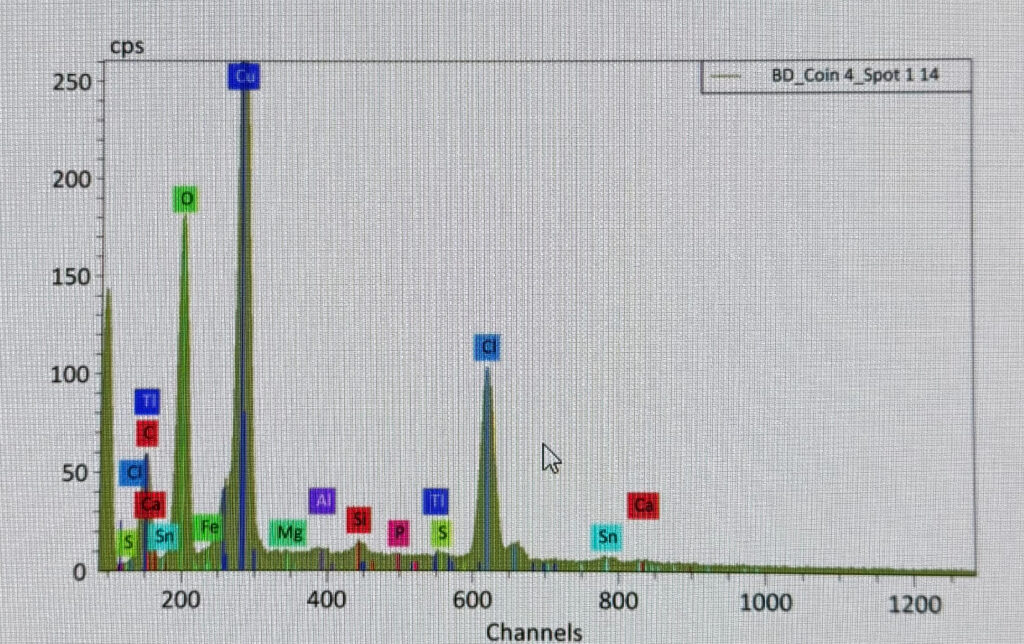
EDS is an analytical technique used for the elemental analysis or chemical characterization of a sample. It generates a spectrum of the unique set of peaks based on its electromagnetic emission spectrum much like XRF.
Results
XRF: The electromagnetic spectra generated from the objects revealed that six of the original twelve sampled objects appeared to have chlorine on their surface. Due to the inherent lack of precision when using a handheld XRF, especially with small objects like coins, further analysis was done.
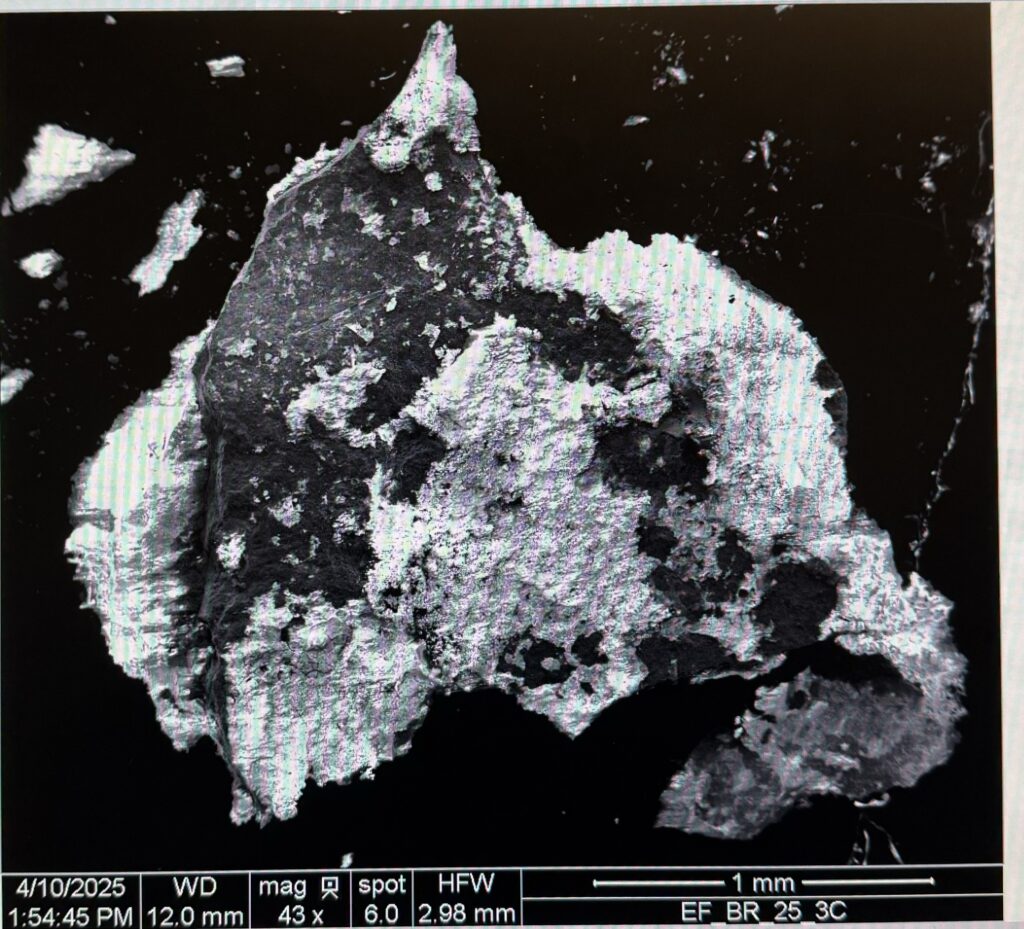
SEM: Images were generated in the form of topographical images as well as compositional density images. Being able to see potential crystal patterns of the corrosion product or the cubic nature of pure copper helped identify what was happening on the surface of the object and how degradation of the material was occurring.
EDS: Using the backscattered electron images, EDS software is able to select areas of interest and perform what we saw with XRF, but with high precision.
> 1971.8.30 Roman Bowl
Chlorine was found in all analytical techniques. Chunks of copper were found on the SEM that had been corroded off the surface of the object.
> 2004.20.191 Roman Republic – triens (185 – 175 BCE)
Chlorine was found in all analytical techniques.
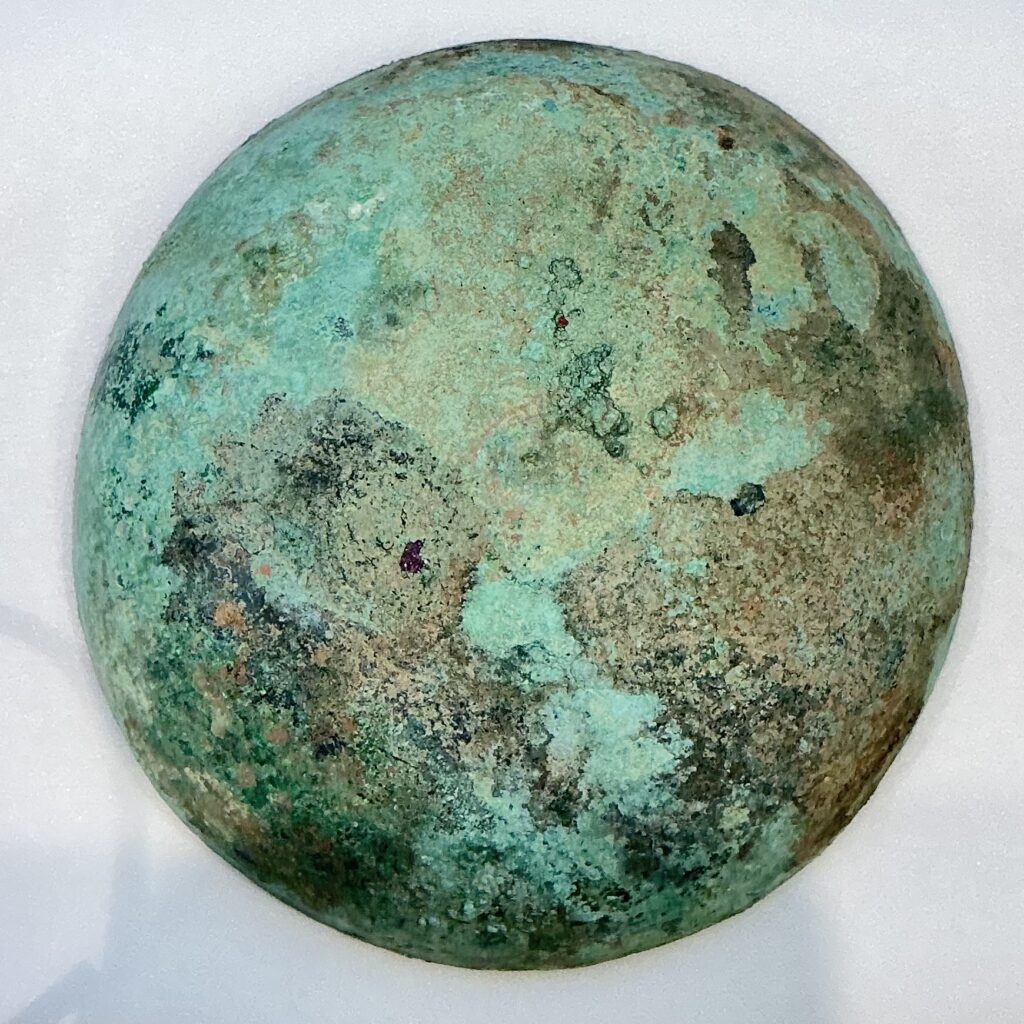
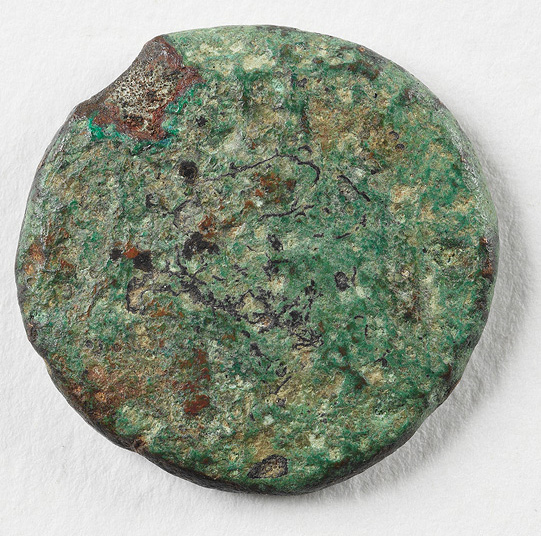
> 2005.11.17 Greek- Drachm (100 – 0 BCE)
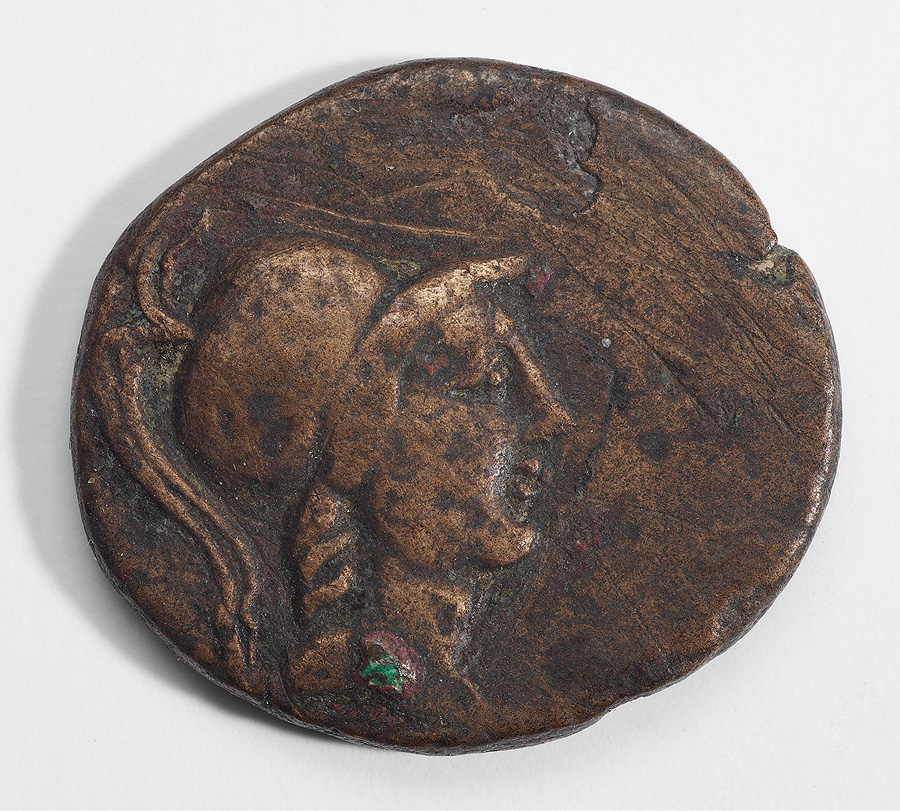
Chlorine was found in all analytical techniques. Bronze disease is isolated to this side of the coin and on that green spot.
> 1971.8.17 Roman

Chlorine was found in all analytical techniques. Chunks of copper were found on the SEM that had been corroded off the surface of the object.