In “Beyond Borders: How Native Land Digital Challenges the Mercator Mindset”, Haruru Segawa critically examines the ways in which world maps perpetuate European political dominance and erase Indigenous geography. They advocate for a platform called Native Land Digital that rejects the idea that people are defined by colonial borders and improves how we look at Indigenous history and culture. Segewa’s masterful essay is a reminder that cartography and the way we are taught to look at the world is anything but politically neutral, but accepting that is the first step towards decolonial work. –Arshie Chaudry ’27
Beyond Borders: How Native Land Digital Challenges the Mercator Mindset
Haruru Segawa ’29
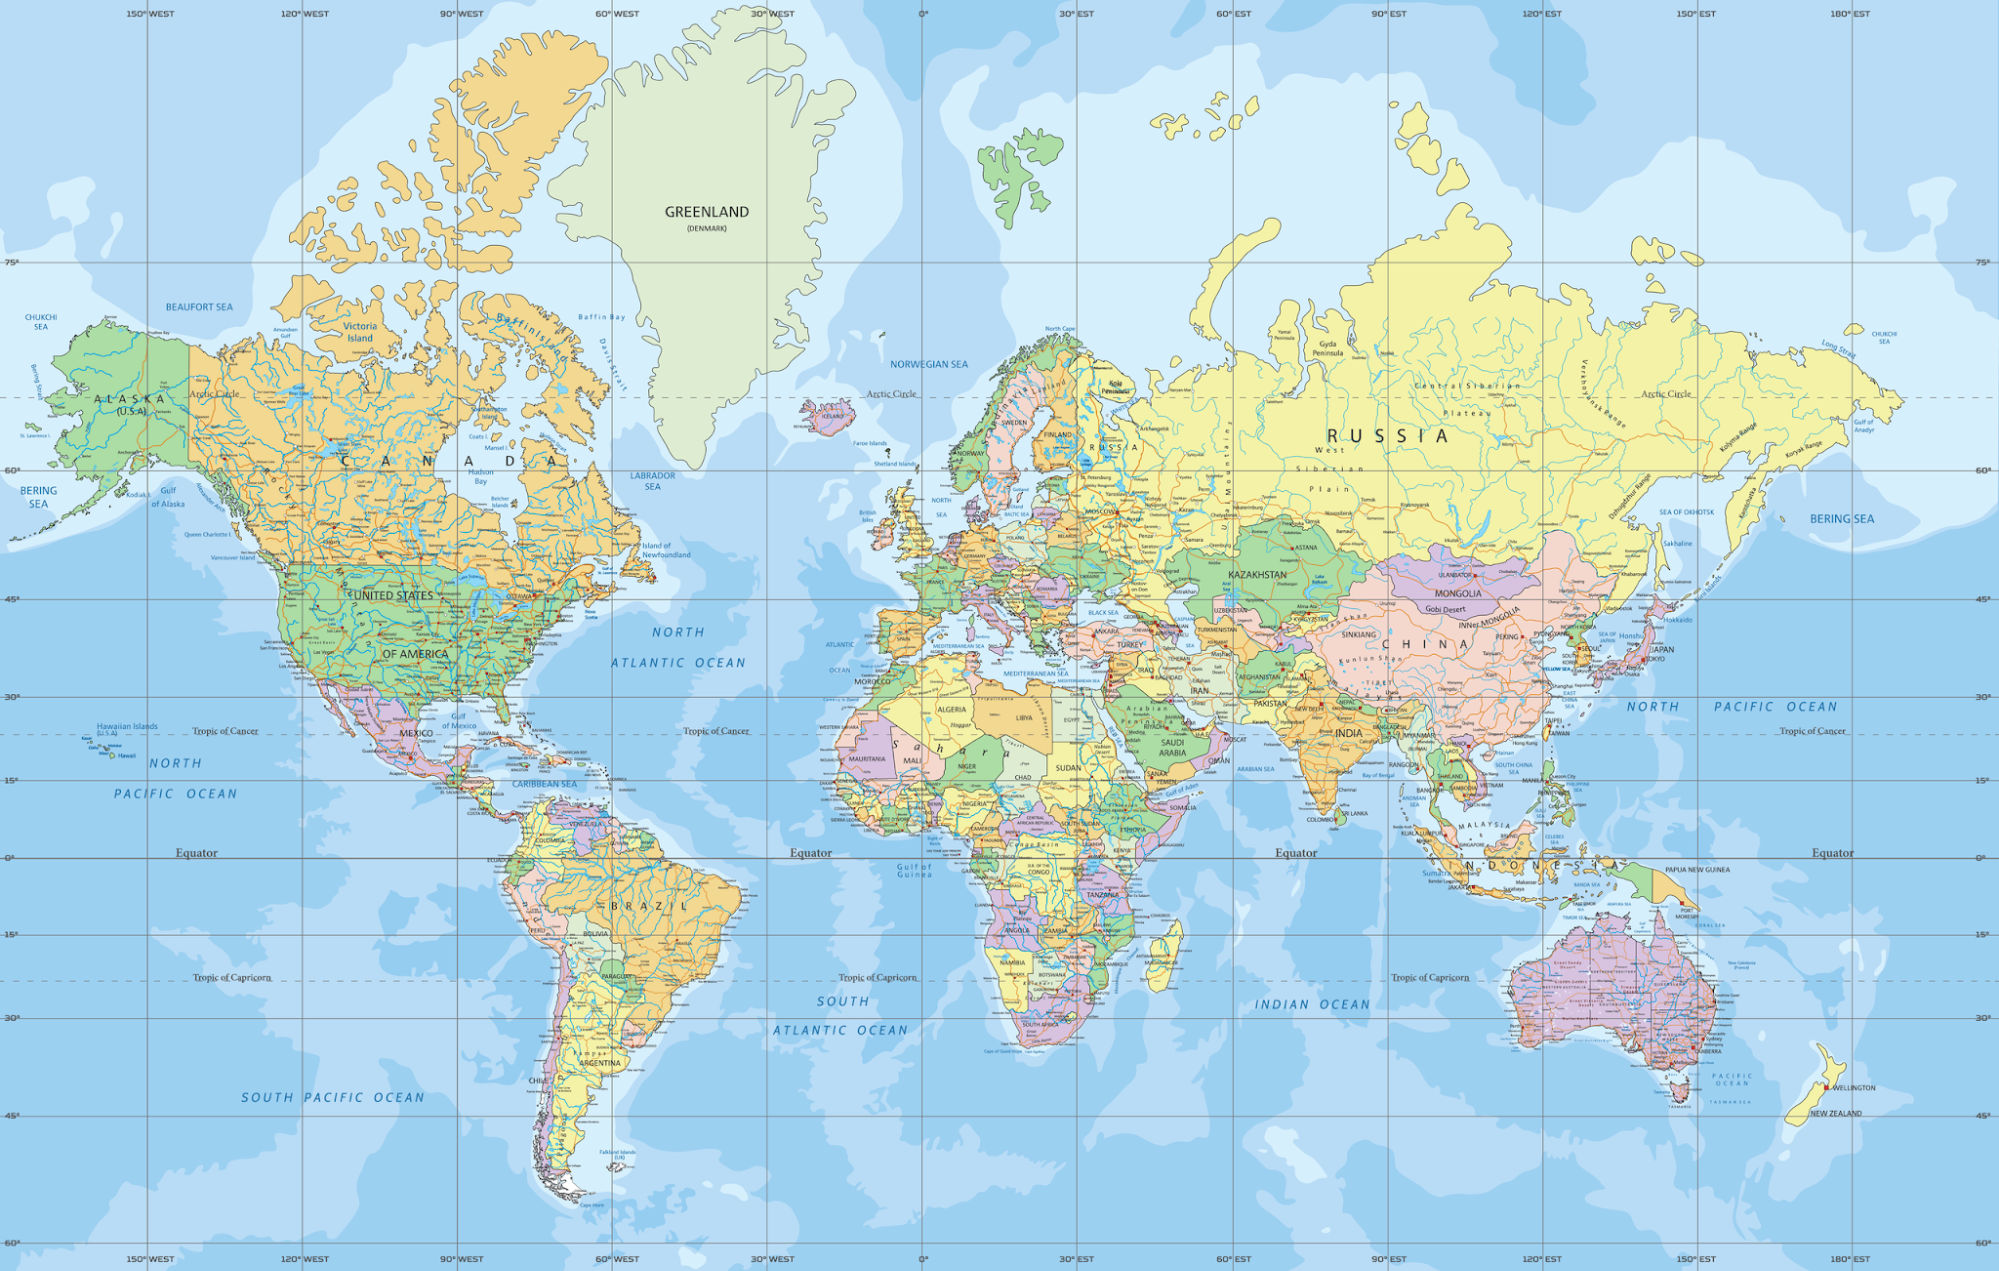
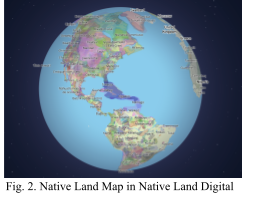
Most people encounter their first world map long before they learn how to question the intentions behind its creation. Its lines and proportions settle into memory as simple facts, giving the deceptive impression that a map is neutral. Presumably, you have seen the Mercator projection (Fig. 1), the rectangular world map that generations of students encounter on classroom walls. For Indigenous communities in particular, territories are often erased or overwritten by colonial cartography. Therefore, restorative mapmaking practices are deeply tied to reclaiming land and sovereignty. The “Native Land Map” in Native Land Digital (Fig. 2) offers radically different ways of understanding space from the Mercator Projection. Native Land Digital challenges the colonial worldview embedded in the Mercator projection by exposing political borders as imposed ruptures rather than natural divisions, using layered representations of Indigenous territories, languages, and treaties to model decolonial cartography that exposes territory as historically contested rather than naturally given.
The widespread adoption of the Mercator projection reflects political history rather than cartographic superiority. Michele Abee shows that the Mercator projection created by Gerardus Mercator in 1569 was designed to assist sailors with straight-line navigation between two points on a flat map. Mercator designed the projection to preserve the 90-degree intersection between latitude and longitude so that sailors could draw a straight line between two locations, measure the angle with a protractor, and reach the destination by maintaining that angle on a compass. However, scientists and publishers soon began applying it beyond this use to general world maps (Abee, 162). In the nineteenth century, influential scientific institutions in Western Europe promoted the projection, and their work filtered into popular atlases and school textbooks (Abee, 162). As a result, the Mercator projection “moved as a physical and ideological tool” across continents, gaining legitimacy through educational and bureaucratic systems (Abee, 162). Mercator was reproduced and distributed across institutions, and it accumulated an authority it had never earned cartographically, even though it consistently elevated Europe’s visual importance.
Although all flat maps of a round world are distorted, cartographic scholars argue that every projection involves choices that make it never neutral. As Dodge explains, Western mapping systems became “crucial to the maintenance of state power” through their roles in defining borders, managing populations, and organizing military and administrative control (Dodge, 297). Their authority comes not from neutrality but from the institutional power behind them. Mapmakers select the information to include, the classification of the landscape, and the features to emphasize (Dodge 299). This can be seen in the Mercator projection, where its rectangular grid causes severe areal exaggeration at high latitudes, making countries like Canada, Russia, and much of Europe appear far larger than they are, while shrinking regions such as Africa, which is closer to the equator (Abee, 152). These “distortions fueled colonial and ethnocentric attitudes” by visually centering Europe and diminishing Africa, South Africa, and South America (Stimpson, 109). Abee further explains that European states used maps as tools of overseas expansion, constructing “imagined communities” that supported their emerging geopolitical identities (Abee, 155). When these maps circulated globally through schools and atlases, they quietly reinforced the idea that European nations were geographically, and by implication, politically dominant. The Mercator projection, therefore, operates not just as a visual distortion but as a mechanism of ideological power, helping justify territorial control and Indigenous erasure.
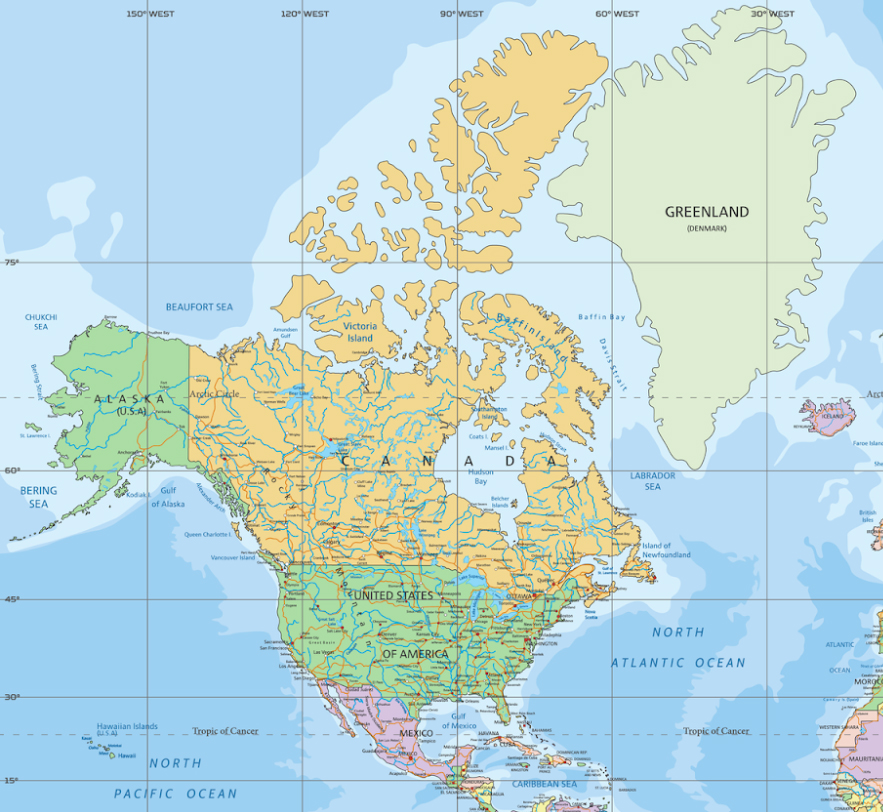
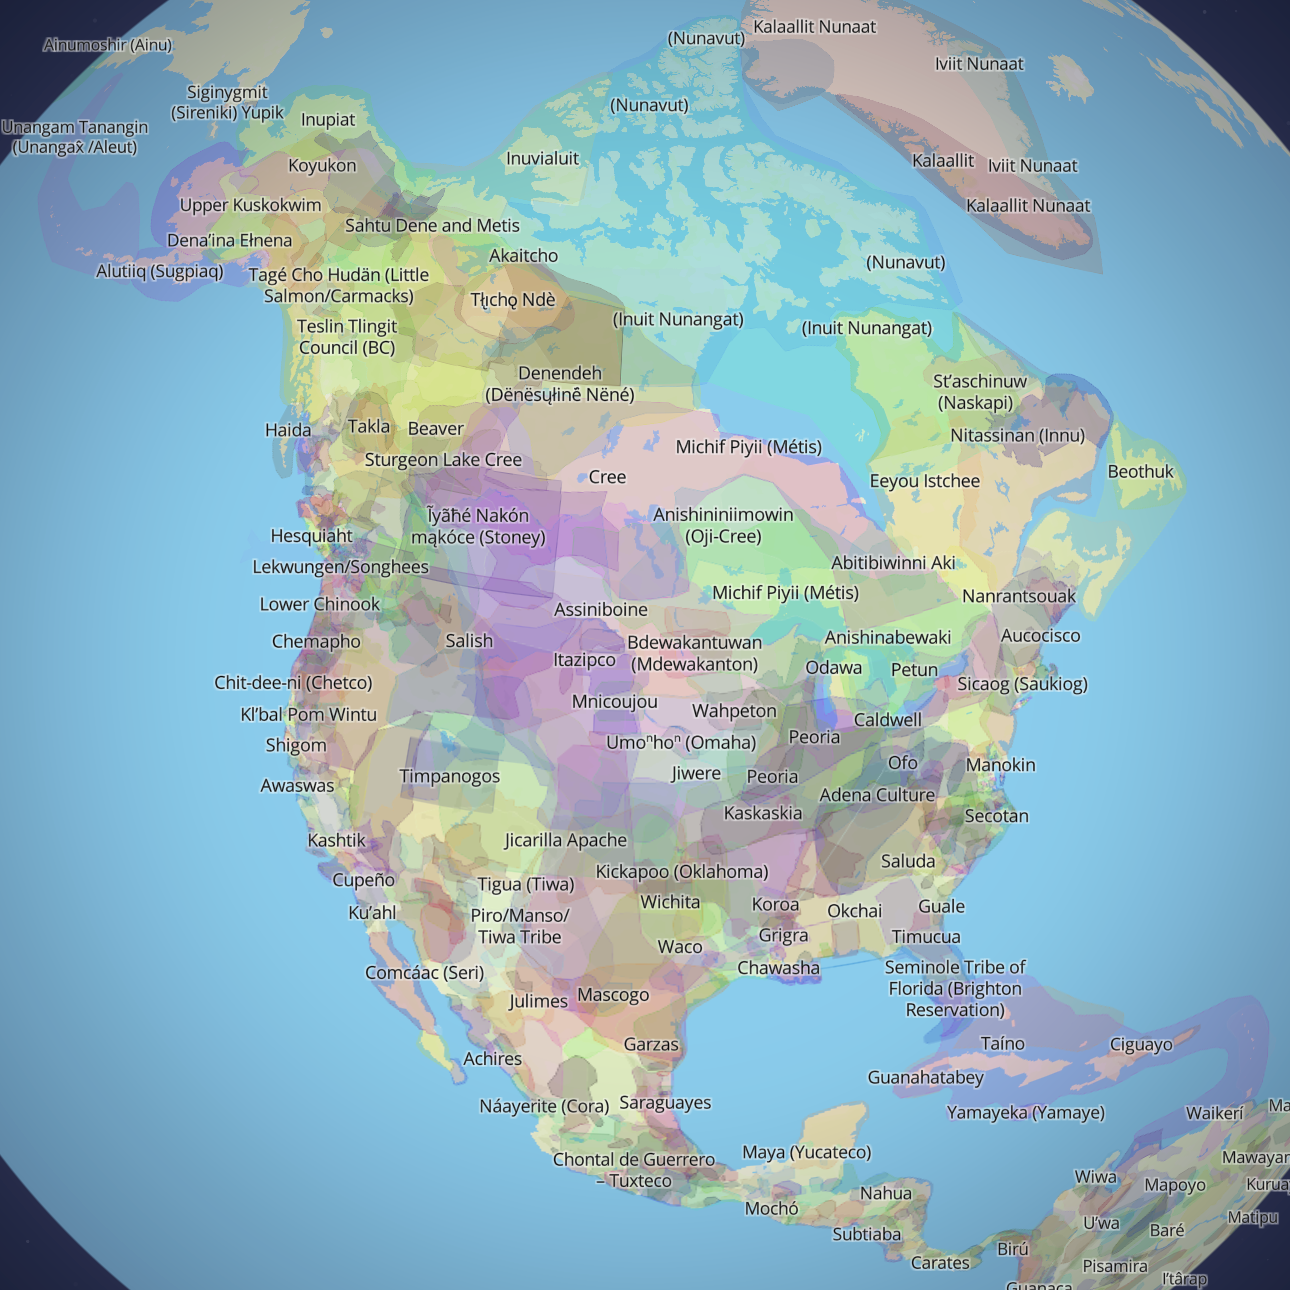
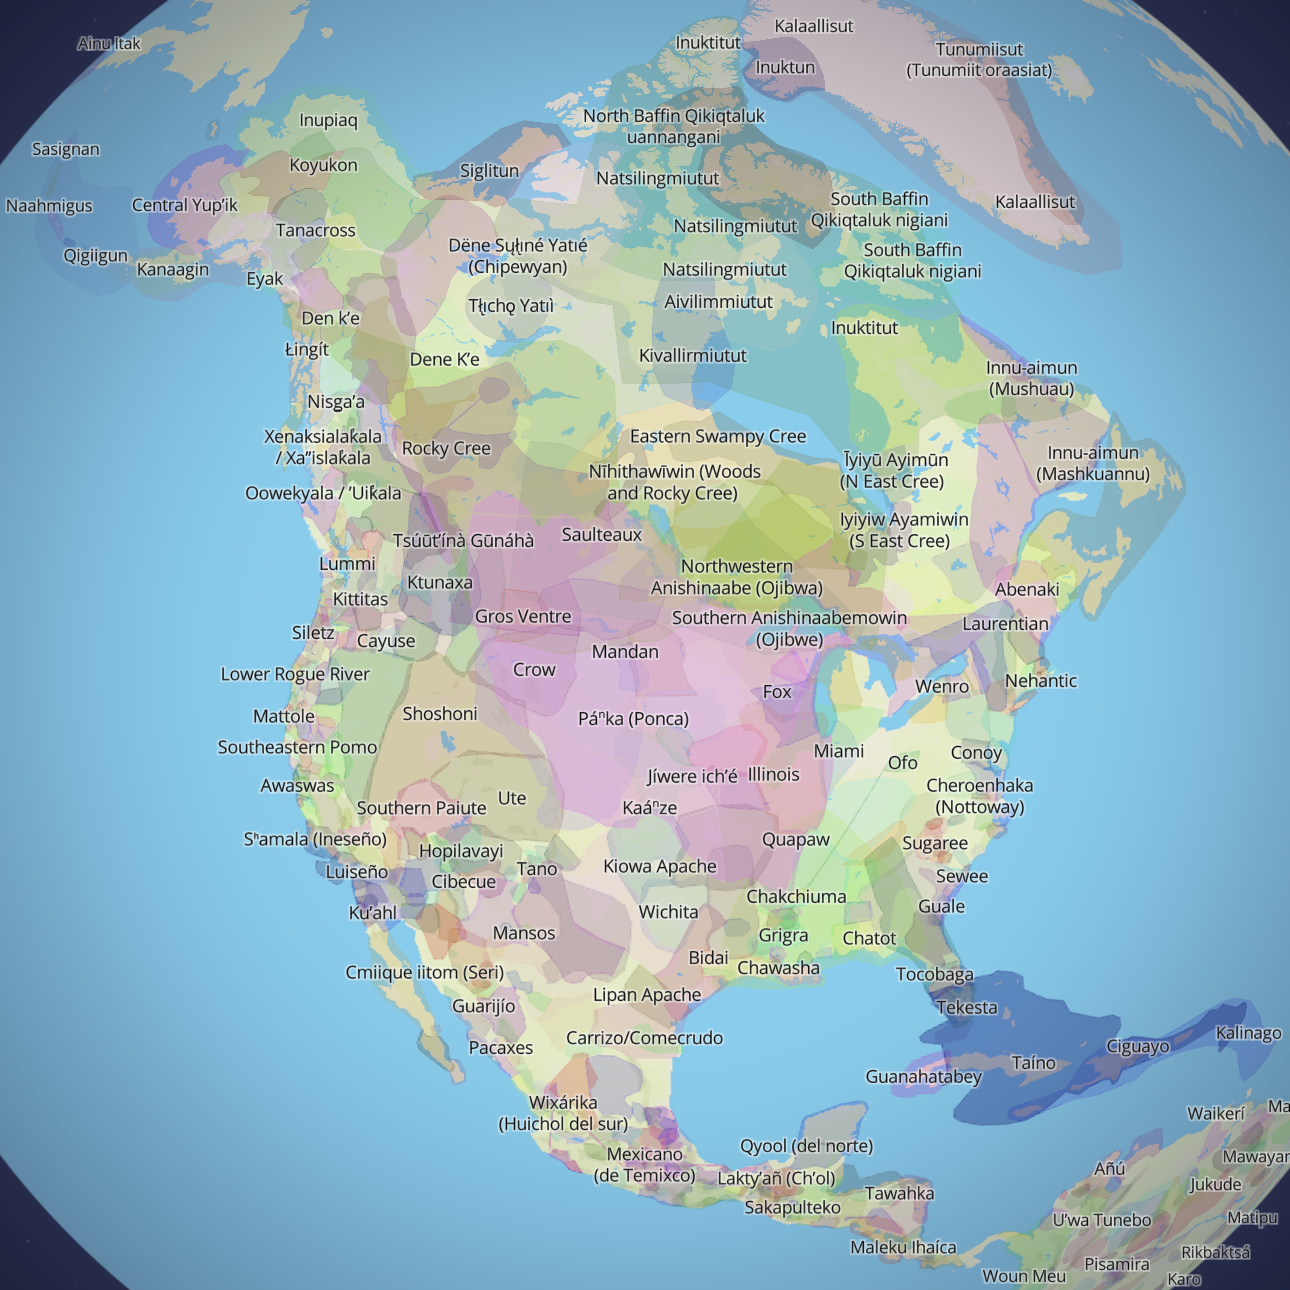
Native Land Digital challenges the colonial worldview embedded in the Mercator projection through a visual strategy Western cartography has long refused. When North America is viewed through the Native Land Map rather than the Mercator projection, land is organized not by nation-states but through overlapping territories, living languages, and treaty histories that expose national borders as colonial impositions. Unlike the Mercator Projection, Native Land Digital treats territories not as something to be owned, exploited, or divided, but as relational. Its mission is “to uplift Indigenous ways of knowing, and build understanding between Indigenous and non-Indigenous peoples” (Native Land Digital). Comparing North America in the Native Land Map (Fig. 6) and the Mercator projection (Fig. 3), the Mercator projection draws a sharp, unbroken border between the United States and Canada, a line so definitive it appears geological. In contrast, the Native Land Map shows Indigenous territories extending across the continent without regard for national borders. This continuity becomes even more evident in the language layer (Fig. 7), where linguistic regions flow across the United States-Canada border, demonstrating that Indigenous communities, communication networks, and cultural knowledge systems predate colonial state boundaries.
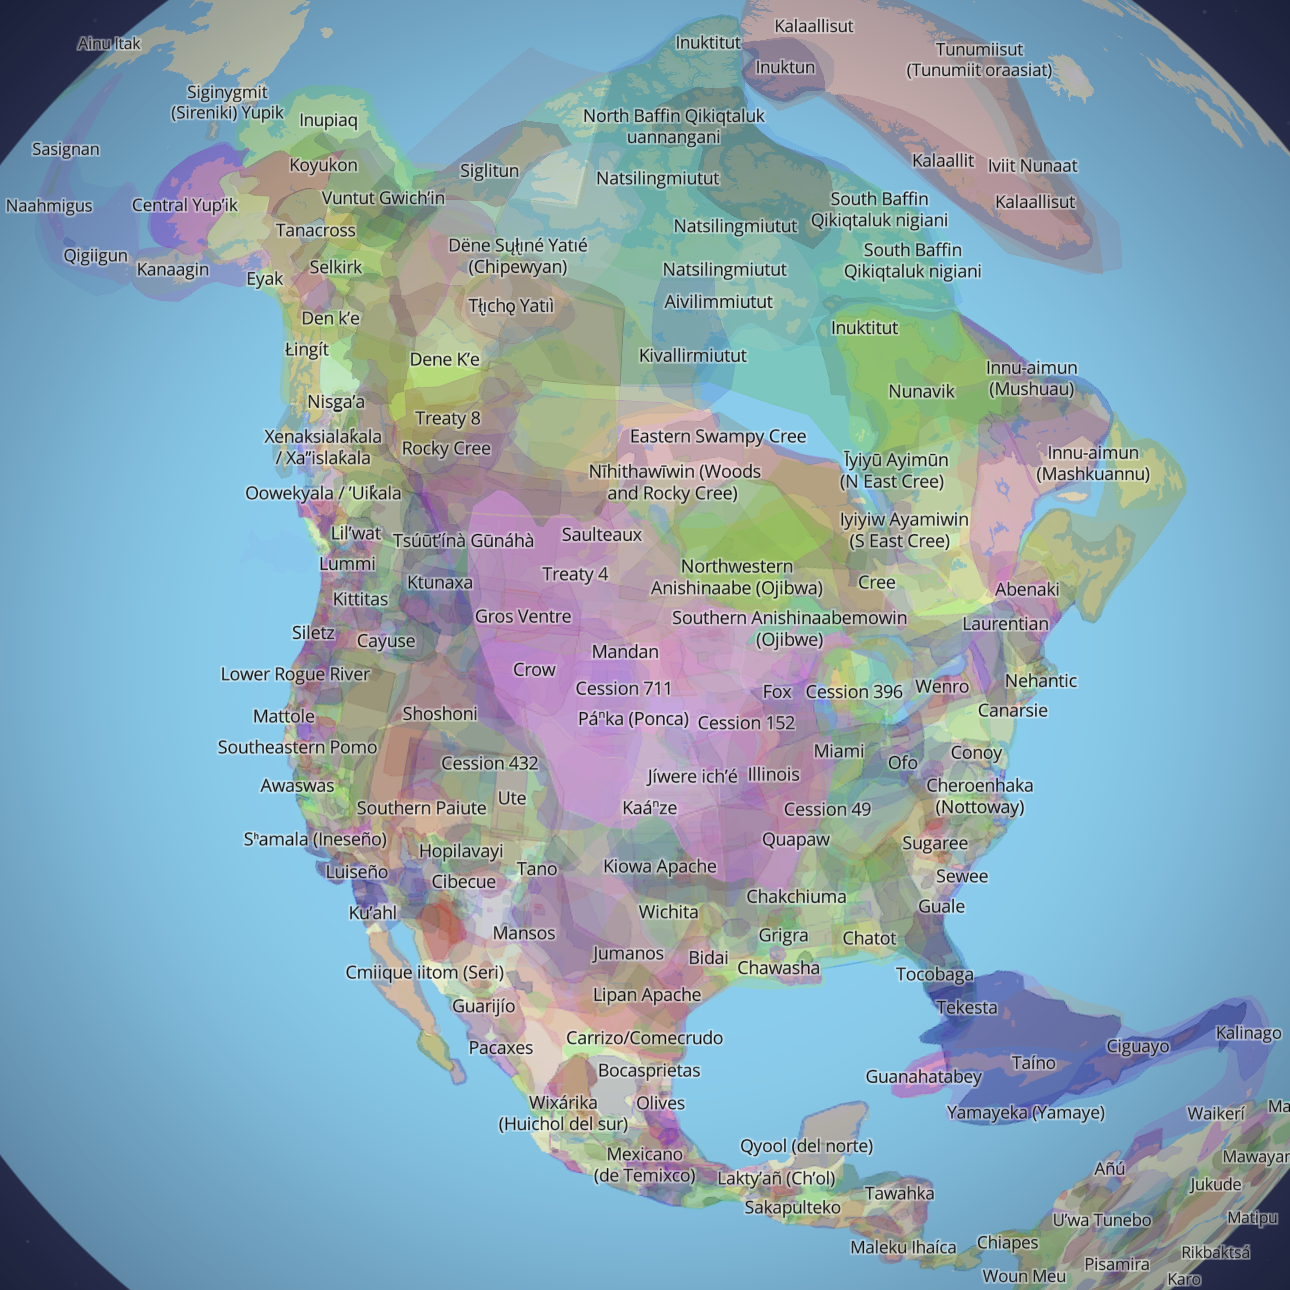
The Native Land Map in Native Land Digital is distinctive for its use of translucent, layered polygons to represent territories, treaties, and languages (Fig. 4). This layered approach rejects Western mapping, which relies on “spatial fixity” and legalistic boundaries that often distort or silence Indigenous spatial realities (Sletto, 147). This matters because, as Sletto warns, when Indigenous lands are forced into rigid, state-defined categories, mapping can “validate state territoriality” and inadvertently deepen colonial control (Sletto, 148). When Indigenous territories are translated into rigid forms, the map can make state borders and authority look natural and legitimate, which results in treating Indigenous land as just another layer of information in a planning system, rather than a recognition of sovereignty. The Tohono O’odham Nation, which resided in what is now southern and central Arizona and northern Mexico, knows this firsthand—the Gadsden Purchase of 1853 drew a 62-mile international border straight through their homeland, cutting families off from cultural and religious life (Tohono O’odham Nation). Native Land Digital resists the Western assumption that a person or a people belongs to one place, defined by one border.
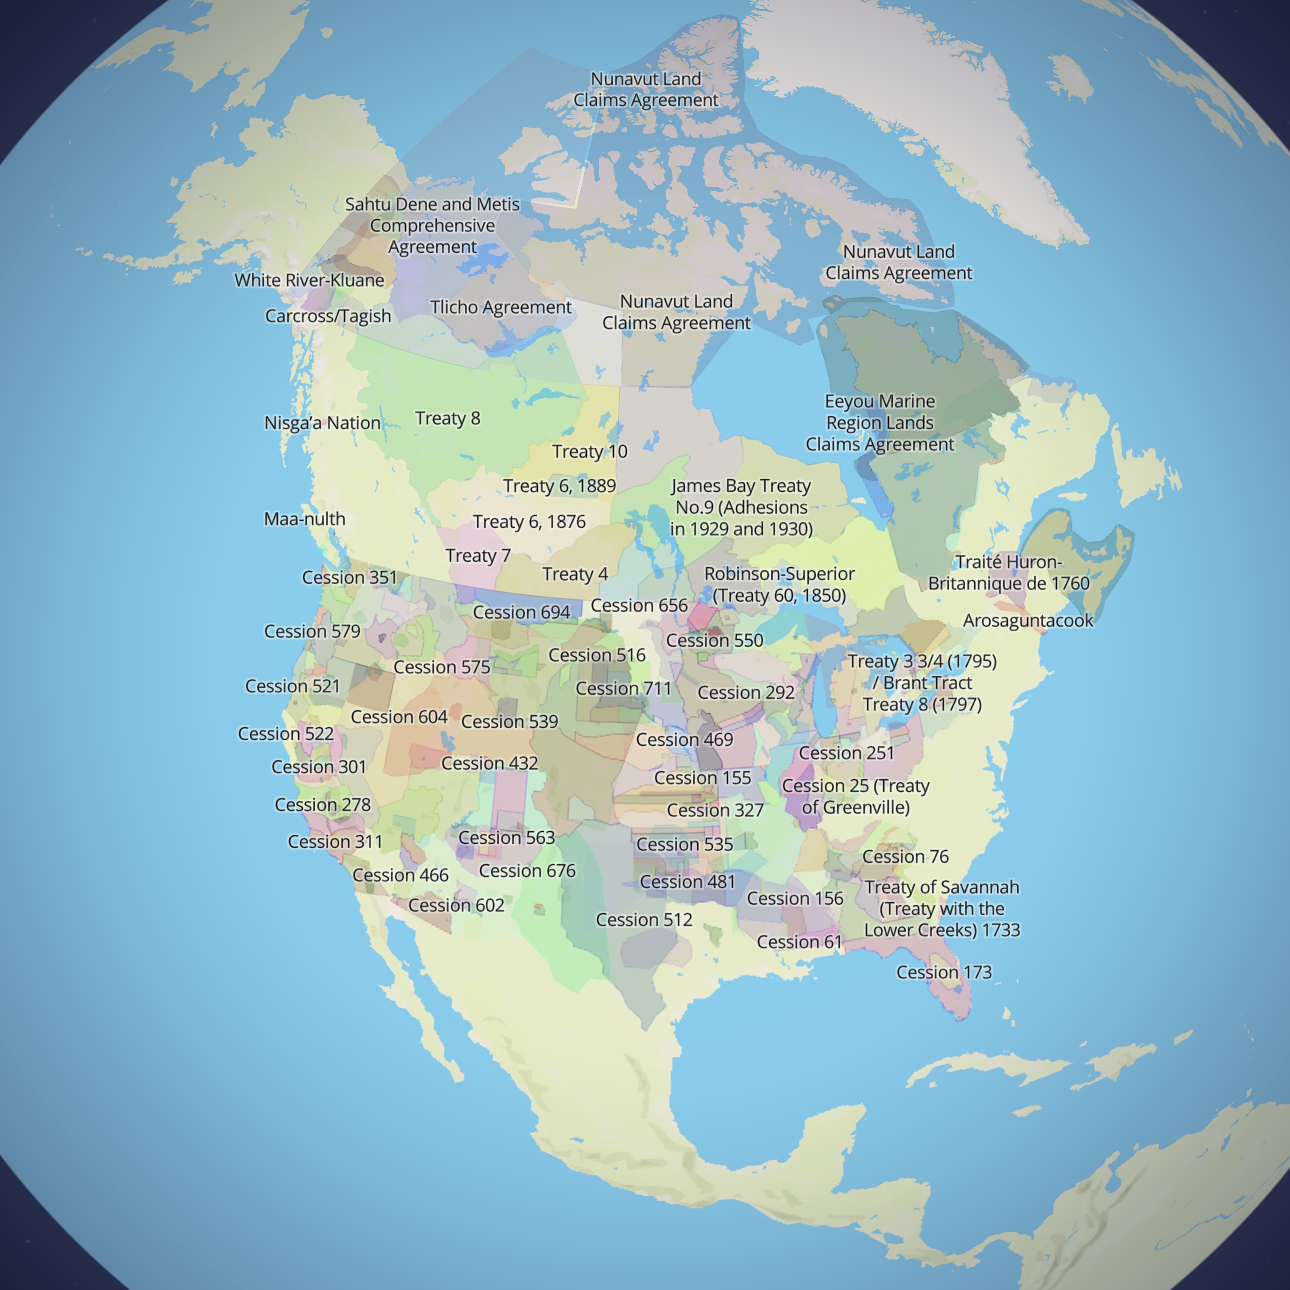
The treaty layer (Fig. 5) introduces a visible rupture. Unlike territories and languages, treaties are sharply bounded and often align with the nation divide—between Mexico, the United States, Canada, and Greenland— revealing how colonial governments imposed legal lines onto land that had previously been organized through relational and cultural systems. The Tohono O’odam Nation’s tribal leaders describe the United States-Mexico border as “an unnatural line” dividing Indigenous homelands (Stephanie Innes Arizona Daily Star, 2). The clear-cut line separating treaty regions illustrates how colonial power fragmented Indigenous space through agreements that divided land administratively, even when Indigenous languages and territories remained continuous. By placing overlapping territories and languages alongside treaty-bounded cuts, Native Land Digital exposes the historical process through which colonial states transformed living, relational land into segmented political spaces—an intervention that the Mercator projection conceals by presenting borders as timeless and inevitable.
Digital platforms open possibilities for decolonial cartography that static maps, frozen in a single perspective, cannot achieve. Unlike the Mercator projection, Native Land Digital allows viewers to move through overlapping territories, toggling between layers across time and space. This ability to toggle between layers makes the colonial construction of space newly visible, inviting viewers to question how they learned the map in the first place. This interactivity further helps counter the illusion of fixity that Western maps produce. Scholars of GIS argue that digital mapping can create new forms of public engagement by allowing users to explore relationships rather than simply receive information (Beimers, 94-98). Native Land Digital uses this potential by representing multiple layers that reveal how Indigenous presence exceeds the borders imposed by colonial states.
The Mercator projection’s staying power has nothing to do with accuracy. It persists because it reflects and reinforces a colonial worldview that privileges Europe, erases Indigenous geographies, and naturalizes political borders. By contrast, Native Land Digital does not simply offer an alternative map. It makes the original problem visible: that borders drawn by colonial governments were never neutral, and that the lands they divided were already spoken for in territories, languages, and treaties that predate those borders by centuries. Digital mapping gives viewers tools to examine these relationships themselves, helping unsettle assumptions inherited from Western cartography. When platforms like Native Land Digital become part of how people learn geography, they open possibilities for recognizing Indigenous sovereignty, correcting historical erasure, and imagining relationships to land that do not depend on colonial boundaries. Changing the maps we use does not automatically change the world—but it does change how we see it, and that is where decolonial work begins.
Works Cited
Abee, Michele. “The Spread of the Mercator Projection in Western European and United States Cartography.” Cartographica: The International Journal for Geographic Information and Geovisualization, vol. 56, no. 2, University of Toronto Press, 2021, pp. 151–65, muse.jhu.edu/article/797597. Accessed 16 Nov. 2025.
Beimers, Henry. Cornerstone: A Collection of Scholarly Cornerstone: A Collection of Scholarly and Creative Works for Minnesota and Creative Works for Decolonizing the Map: Indigenous Maps and GIS Decolonizing the Map: Indigenous Maps and GIS. Mar. 2022, cornerstone.lib.mnsu.edu/cgi/viewcontent.cgi?params=/context/etds/article/2182/&path_info=Beimers_Henry.pdf.
Dodge, Martin. Classics in Cartography. John Wiley & Sons, 2011.
Misachi, John. “World Map – Mercator Projection.” WorldAtlas, 18 May 2021, www.worldatlas.com/geography/world-map-mercator-projection.html. Accessed 13 Dec. 2025.
Native Land Digital. “Native-Land.ca | Our Home on Native Land.” Native-Land.ca, Native-Land.ca, 2022, native-land.ca/about/why-it-matters.
Sletto, Bjørn. “Special Issue: Indigenous Cartographies: Introduction.” Cultural Geographies, vol. 16, no. 2, Sage Publications, Ltd., 2009, pp. 147–52, https://www.jstor.org/stable/44251524. JSTOR.
Stimpson, Ashley. “WHAT WE GET WRONG About the World’s MOST MALIGNED MAP.” National Geographic, vol. 248, no. 4, Oct. 2025, pp. 108–11. EBSCOhost, research.ebsco.com/linkprocessor/plink?id=7b123e94-0544-3884-8dc3-f6d0e8f5d97e.
Stephanie Innes Arizona Daily Star. Tohono O’odham Leaders: Trump’s Wall Won’t Rise on Tribal Borderland. 20 Feb. 2017, www.tonation-nsn.gov/wp-content/uploads/2017/02/Tohono-Oodham-Leaders-Trumps-Wall-Wont-Rise-on-Tribal-Borderland.pdf.Accessed 30 Jan. 2025.
Tohono O’odham Nation. “No Wall – Tohono O’odham Nation.” Tohono O’odham Nation, 6 Mar. 2017, www.tonation-nsn.gov/nowall/. Accessed 20 Mar. 2026.
Recent Comments